

How to Understand a DataRobot Model: Unlocking How a Model Was Made [Part 7]
One of my favorite things about Chinese culture is going out with friends and family for dim sum on the weekend. Dim sum is prepared as small bite-sized portions of food served in small steamer baskets or on small plates. Dim sum dishes are served for brunch or lunch. In my hometown, dim sum is also known as yum cha, and my friends and I would organize large groups to go to Chinatown on the weekend to dine.

But despite my love for dim sum, I’m not well suited to this cuisine. I have a seafood allergy and many dim sum dishes contain shrimp. I’m constantly asking my wife, “What’s in this dumpling?” or “Does this contain seafood?” and waiting for her to translate the dishes into English for me. I know the dishes are going to be yummy, but I also care about what went into them.
Just as I care about the ingredients in my dim sum, some people want to know the ingredients in the machine learning algorithm that powers their artificial intelligence (AI). They want to know how the data was prepared to suit the algorithm, any feature engineering applied to the data, and whether any post-processing was applied to the algorithm’s results.
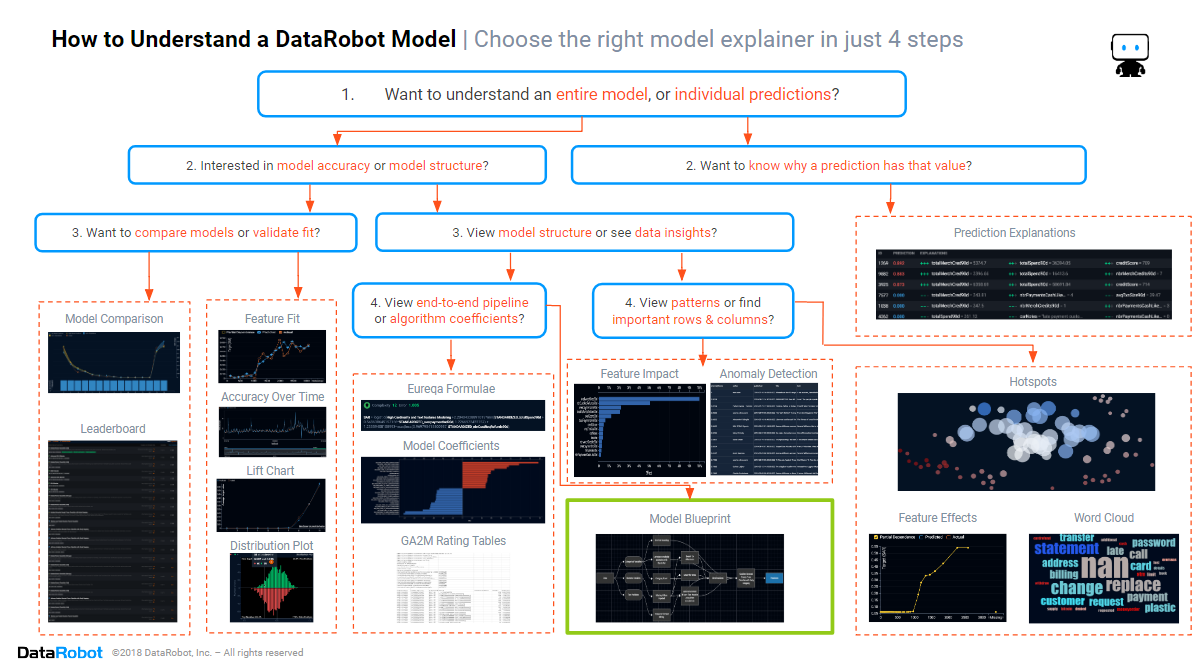
In the previous blogs in this series, we learned how to assess the model accuracy, which columns and rows are important in the data, and how to discover the patterns in the data that the model is using. In this blog, we will focus on the section of the cheat sheet marked in green above–discovering how to see the data preparation, feature engineering, and post-processing that each blueprint has used. Model blueprints are the core of DataRobot’s technology, encapsulating data processing, feature engineering, and model tuning.
Data processing and feature engineering are often overlooked when building machine learning models, even though they are essential to building a great model and are much more complicated to master. Research shows that “selecting the best model and tuning it leads to approximately a 20% increase in accuracy, up to more than a 60% improvement for certain datasets”. DataRobot’s model blueprints are data science recipes, combining best-practice data science processes as the ingredients, used and tested by the world’s best data scientists, packaged ready to produce high-quality machine learning algorithms. And this production-line quality and accuracy directly impacts the bottom line. One organization that switched to DataRobot’s model blueprints reported saving hundreds of millions of dollars per annum via improved model accuracy.
Historically, data scientists manually created scripts that trained and ran the machine learning algorithms that powered AI. Each script was craftsman made, a work of art, and each one unique. Scripts can be written in many different languages (e.g., Python, Java, Julia or R), but one thing that all scripts have in common is that they are not suitable for a normal business person to understand. Over the past decade, many standard machine learning libraries have been released by the open source community, removing the need to script every detail, but scripts that use these libraries remain too complex for a normal business person to comprehend. Scripted solutions are little better than black box solutions to anyone who is not an experienced data scientist.
In the modern AI-driven organization, there are dozens, if not hundreds, of machine learning algorithms deployed throughout the organization, too many for each and every one to be built manually using complex scripting. Much like modern organizations manage their software, the modern AI-driven organization wants standardization of AI workflows, repeatability, reduced human error, reduced key-man risk, and human-friendly and regulator-friendly documentation of each and every AI.
Blueprint Diagrams
In the previous blog in this series, we saw how to obtain the mathematical formula for a trained algorithm. But sometimes there is a need to see the inside of the model to see how it prepares the data, newly generated features, and any post-processing it does. For example, one blueprint may improve accuracy by applying credibility weighting, while another may use automated feature engineering to improve accuracy by adding cluster analysis. Sometimes there is a need to find the source of an algorithm, the academic papers behind its methodology, or the open source library from which it was sourced. Maybe the regulator wants to know the details. Maybe your boss, the Analytics Director, wants to know how this model is different from another model that you fitted to this data. Maybe one of your fellow data scientists wants to review your choice of model or wants ideas about what may work for their project. Or maybe one of your business colleagues wants to know whether the text features were used after the other features had first been applied.
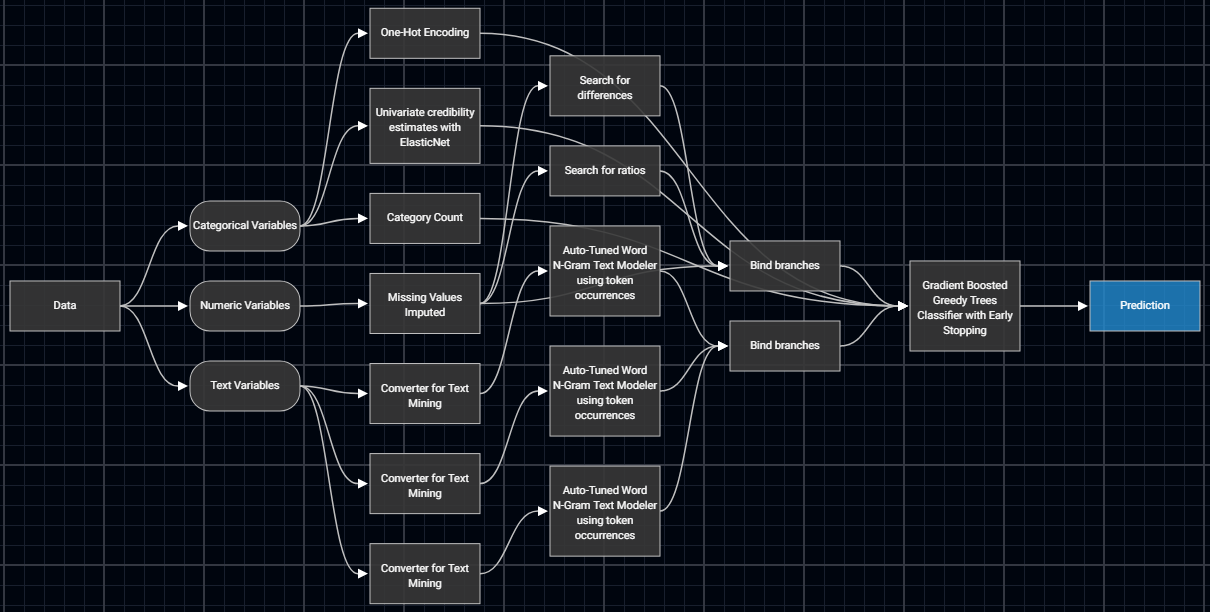
Above is a screenshot of a more complex model blueprint for a Gradient Boosted Greedy Trees algorithm fitted to Lending Club’s loan data, used to predict which loans will go bad. Blueprint diagrams always start with a Data box and end with a Prediction box. After the Data box, each feature is split by its data type, so that the most appropriate pre-processing can be applied to prepare it for the algorithm. The next rounds of boxes are for data processing and feature engineering. Then there is a machine learning algorithm taking this data, to learn from, or to calculate new predictions. Sometimes there is an extra step after the machine learning algorithm, where text mining is trained on the residual errors from the main algorithm, or sometimes there is a prediction scaling step after the main algorithm. You can find a quick explanation of this particular blueprint in our blog about automated feature engineering.
To get the documentation for any step, simply click on the box for that step. This will open documentation that explains what that box does within the pipeline and often provides links to published research and/or the open sources libraries it uses.
How to Interpret the Blueprint Diagram Above:
- The features are split by data type into categorical, numeric, and text.
- For categorical features:
- the data is prepared by applying one-hot encoding, and
- new features are generated by counting the occurrence.
- For numeric features:
- the data is prepared by doing missing value imputation, and
- new features are generated by subtracting one numeric field from another, or by dividing one numeric field by another.
- For text features, the raw text data is turned into numeric data, suitable for this machine learning algorithm, by first running text mining algorithms on each of the three text features in this data.
- The main algorithm being used is a Gradient Boosted Greedy Trees Classifier with Early Stopping. Clicking on the box to get the documentation shows us a description of what this algorithm does and tells us that this algorithm was sourced from the scikit-learn library in Python.
- There is no post-processing after the main algorithm. Text mining is used to create primary features to fit against the target column. No scaling of predictions is required.
Conclusion
The path to trusting an AI includes knowing whether the way it is using the data is suitable and reasonable. The path to building an AI involves training multiple machine learning algorithms to find the one that best suits your needs, and the only practical way for you to quickly find the model that is suitable is to use automated machine learning, which generates visualizations of the pipelines of each and every blueprint. If your AI is a black box that can’t visualize the pipelines it uses, then it’s time to update to DataRobot for models that you can trust. Click here to arrange for a demonstration of DataRobot’s human-friendly insights, showing how you can trust an AI.


Colin Priest is the VP of AI Strategy for DataRobot, where he advises businesses on how to build business cases and successfully manage data science projects. Colin has held a number of CEO and general management roles, where he has championed data science initiatives in financial services, healthcare, security, oil and gas, government and marketing. Colin is a firm believer in data-based decision making and applying automation to improve customer experience. He is passionate about the science of healthcare and does pro-bono work to support cancer research.
-
How to Choose the Right LMM for Your Use Case
April 18, 2024· 7 min read -
Belong @ DataRobot: Celebrating 2024 Women’s History Month with DataRobot AI Legends
March 28, 2024· 6 min read -
Choosing the Right Vector Embedding Model for Your Generative AI Use Case
March 7, 2024· 8 min read
Latest posts
