

Marketing Attribution, Artificial Intelligence, and Game Theory

More and more companies have been asking me about multichannel marketing attribution, especially since we posted the popular white paper and webinar on this topic. Two of the most common questions I’ve received are:
- Why do I need game theory to do marketing attribution (and how does a Shapley Value work)?
- Why do I need a model to do marketing attribution?
I’m going to address both of these questions by walking through a number of different scenarios that should help clear up any confusion.
Case 1: Zero Marketing Touchpoints
Let’s start with the easiest scenario: there are zero marketing touchpoints, and you have sales of $1,000. If you have zero marketing touchpoints, then all $1,000 of your sales are baseline sales— no sales are attributable to marketing, and attribution is trivial. 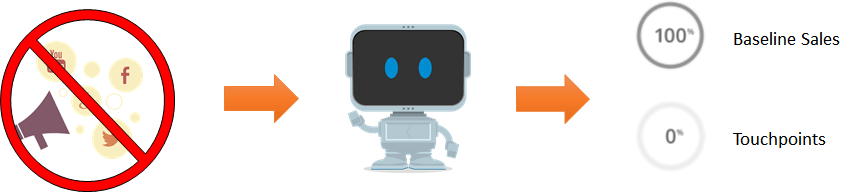
Case 2: One Marketing Touchpoint
You want more sales, so you start marketing using touchpoint A and your sales increase to $4,900.
If you used the popular but obsolete and flawed “last touchpoint” methodology, you will attribute all of the sales to touchpoint A with a value of $4,900. But, this is inconsistent with economic theory, which says that the value of a good or service is its marginal utility. You already had $1,000 in sales, so touchpoint A is worth $4,900 – $1,000 = $3,900.
Phew, that wasn’t too difficult to calculate! 
Case 3: Two Marketing Touchpoints
Buoyed by your marketing success with touchpoint A, you add touchpoint B. Sales increase to $6,200. You quickly conclude that touchpoint B is worth $6,200 – $4,900 = $1,300, but you are about to learn differently. While you are away on leave, your staff forgets to run touchpoint A, and for a period you only have touchpoint B running. Sales drop to $5,000. After you return from leave and reinstate touchpoint A, sales return to $6,200.
| Scenario | Sales |
| No Marketing | $1,000 |
| Touchpoint A only | $4,900 |
| Touchpoint B only | $5,000 |
| Touchpoints A + B | $6,200 |
When you reinstated touchpoint A, sales increased by $1,200. Does that mean that touchpoint A is actually worth $1,200? Or is it worth $3,900 like we calculated in the section about one touchpoint?If touchpoint B gives you sales of $5,000 on its own, does that mean that touchpoint B is actually worth $5,000 – $1,000 = $4,000? Or is it worth $1,300 as we calculated in the previous paragraph?
What we know is that the total value of A plus the value of B must equal $6,200 – $1,000 = $5,200.
We need a solution such that:
A + B = 5200, and
1200 <= A <= 3900, and
1300 <= B <= 4000
For the example above there is a range of values for A and B that satisfy all of these conditions, but as we add more touchpoints, we will discover that there is really only one general solution that works across many touchpoints— the Shapley Value. If you look it up online, you will see a complicated looking formula:
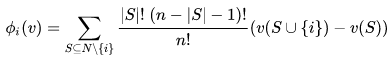
but if you look at worked examples, you start to see that it is actually quite simple to calculate. Just get all of the attribution orders, measure the marginal contribution for each, and take the average.
For our example, the Shapley Values are:
Touchpoint A = (1200 + 3900) / 2 = $2,550
Touchpoint B = (1300 + 4000) / 2 = $2,650
Wow, that’s so much easier than the complicated formula!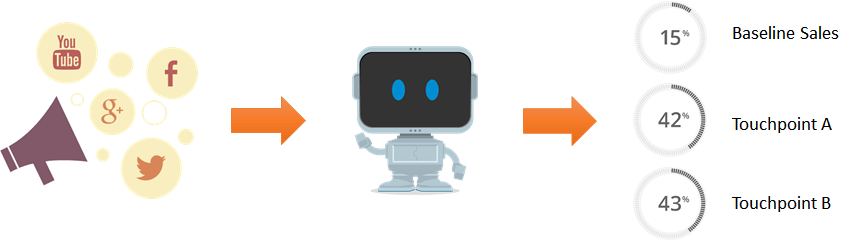
Case 4: Three Marketing Touchpoints
You want more sales, so you add a third marketing touchpoint, and sales increase to $6,450. Now you want to know the value of touchpoint C, and revise the values of touchpoints A and B. To do the calculation, you need to know values for all the combinations of A, B, and C, and the predicted sales from those combinations, as seen below:
| Scenario | Sales |
| No marketing | $1,000 |
| Touchpoint A only | $4,900 |
| Touchpoint B only | $5,000 |
| Touchpoint C only | $4,100 |
| Touchpoints A + B | $6,200 |
| Touchpoints A + C | $6,150 |
| Touchpoints B + C | $6,300 |
| Touchpoints A + B + C | $6,450 |
To get the Shapley Value for C, we calculate the average marginal contribution of C in each of the scenarios that contains C:
(Touchpoint C only) – (No marketing), and
(Touchpoints A + C) – (Touchpoint A only), and
(Touchpoints B + C) – (Touchpoint B only), and
(Touchpoints A + B + C) – (Touchpoints A + B)
The Shapley Value calculation for C is:
((4100-1000) + (6150-4900) + (6300-5000) + (6450-6200)) / 4
= (3100 + 1250 + 1300 + 250) / 4 = $1,475
Similar calculations apply to touchpoints A and B:
Shapley Value for A = $1,825
Shapley Value for B = $1,950
Where Do The Sales Estimates Scenarios Come From?
In the earlier sections I described a situation in which a business could have experienced natural experiments that showed how sales varied with each possible combination of touchpoints. This was easy to imagine when there were only 1 or 2 marketing touchpoints, but in the last case (Case 4) I showed a set of 8 scenarios, comprising sales from different combinations of marketing touchpoints. As the number of touchpoints grow, the number of scenarios grows exponentially.
If there are 10 touchpoints, then you need to know sales estimates for 1024 scenarios!
In digital marketing, it is not uncommon to have 30 or more touchpoints before a sale. In such circumstances, it quickly becomes impractical to do A/B testing on all possible combinations of marketing touchpoints.
The solution is to build an artificial intelligence (AI) that predicts the outcomes of each scenario based upon sales and touchpoint combinations observed in historical data. 
Building an AI Can Be Difficult and Time Consuming…
Building such models is difficult. It typically requires teams of data scientists manually designing and testing machine learning algorithms. This can take months, even assuming you can find data scientists, who are in short supply. By the time the AI is built, consumer behavior may have changed.
A New and Easier Way – Automated Machine Learning
The solution is automated machine learning such as DataRobot, which is an expert system that (with one click of a button) quickly finds the most accurate machine learning algorithms and data preparation techniques for your particular data. Instead of waiting for weeks or months, you could have a solution in hours or less. What’s more, DataRobot will give human-friendly explanations of what the AI is doing, so you can trust its decisions.
About the Author
Colin Priest is the Director of Product Marketing for DataRobot, where he advises businesses on how to build business cases and successfully manage data science projects. Colin has held a number of CEO and general management roles, where he has championed data science initiatives in financial services, healthcare, security, oil and gas, government, and marketing. Colin is a firm believer in data-based decision making and applying automation to improve the customer experience. He is passionate about the science of healthcare and does pro-bono work to support cancer research.

Colin Priest is the VP of AI Strategy for DataRobot, where he advises businesses on how to build business cases and successfully manage data science projects. Colin has held a number of CEO and general management roles, where he has championed data science initiatives in financial services, healthcare, security, oil and gas, government and marketing. Colin is a firm believer in data-based decision making and applying automation to improve customer experience. He is passionate about the science of healthcare and does pro-bono work to support cancer research.
-
Belong @ DataRobot: Celebrating 2024 Women’s History Month with DataRobot AI Legends
March 28, 2024· 6 min read -
Choosing the Right Vector Embedding Model for Your Generative AI Use Case
March 7, 2024· 8 min read -
Reflecting on the Richness of Black Art
February 29, 2024· 2 min read
Latest posts
