

New World. Old Model. Now What?
May You Live In Unprecedented Times
2020’s word of the year is likely to be “unprecedented” — which, from a data science perspective, might make us rather nervous. Machine learning is, after all, the art and science of predicting outcomes of incoming events based on historical data. In a period without precedent, doesn’t this make our historical training data irrelevant? And more broadly, how do we make our models adapt to these times?
Our customers have been asking us these questions a lot. In this blog post, we’ll summarize our twelve-point plan for ensuring that our machine learning models continue to be relevant and add business value.
Check your priorities. Which models to look at first?
First, let’s rank our deployed models in order of importance to your business; we will want to work our way down them in descending order of priority! Once we’ve established which model to look at, there are a number of steps we should work through.
Check your models. Is the accuracy changing? Is the data drifting?
First of all, you need to understand whether it’s actually the behavior of the system that we have modeled that is changing. We also want to identify whether the system’s behavior has stayed the same, but the data going into it has changed substantially.
If we know the outcomes of our predictions, the first thing we should do is to examine how our models are performing in terms of accuracy. DataRobot’s model accuracy monitoring will give us an initial read on what we may need to do — has there been a drop in accuracy in 2020, in terms of the metric we care about?
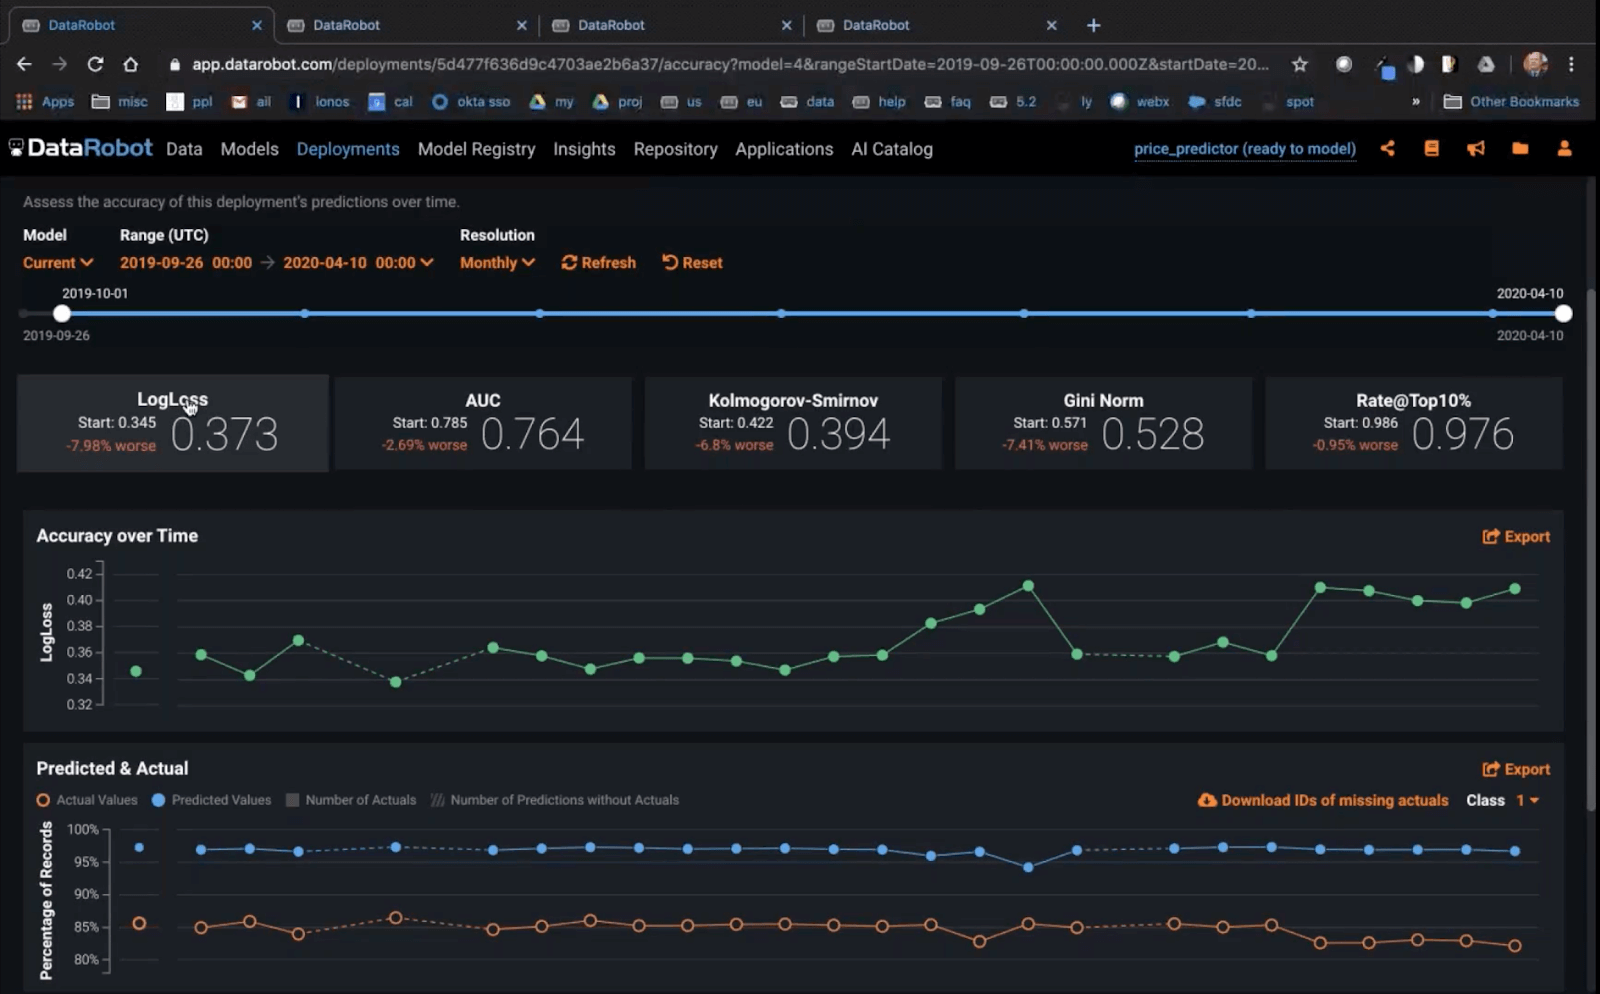 Above: DataRobot accuracy tracking
Whether or not we know the outcomes of our recent predictions, we also want to track how the distribution of our input data and our recent model predictions have evolved. Using DataRobot’s data drift deployment monitoring, the top features by impact plus the target variable are plotted, allowing us to quickly see whether the data on our model’s most important inputs has strayed away significantly from the ranges we originally trained the model on.
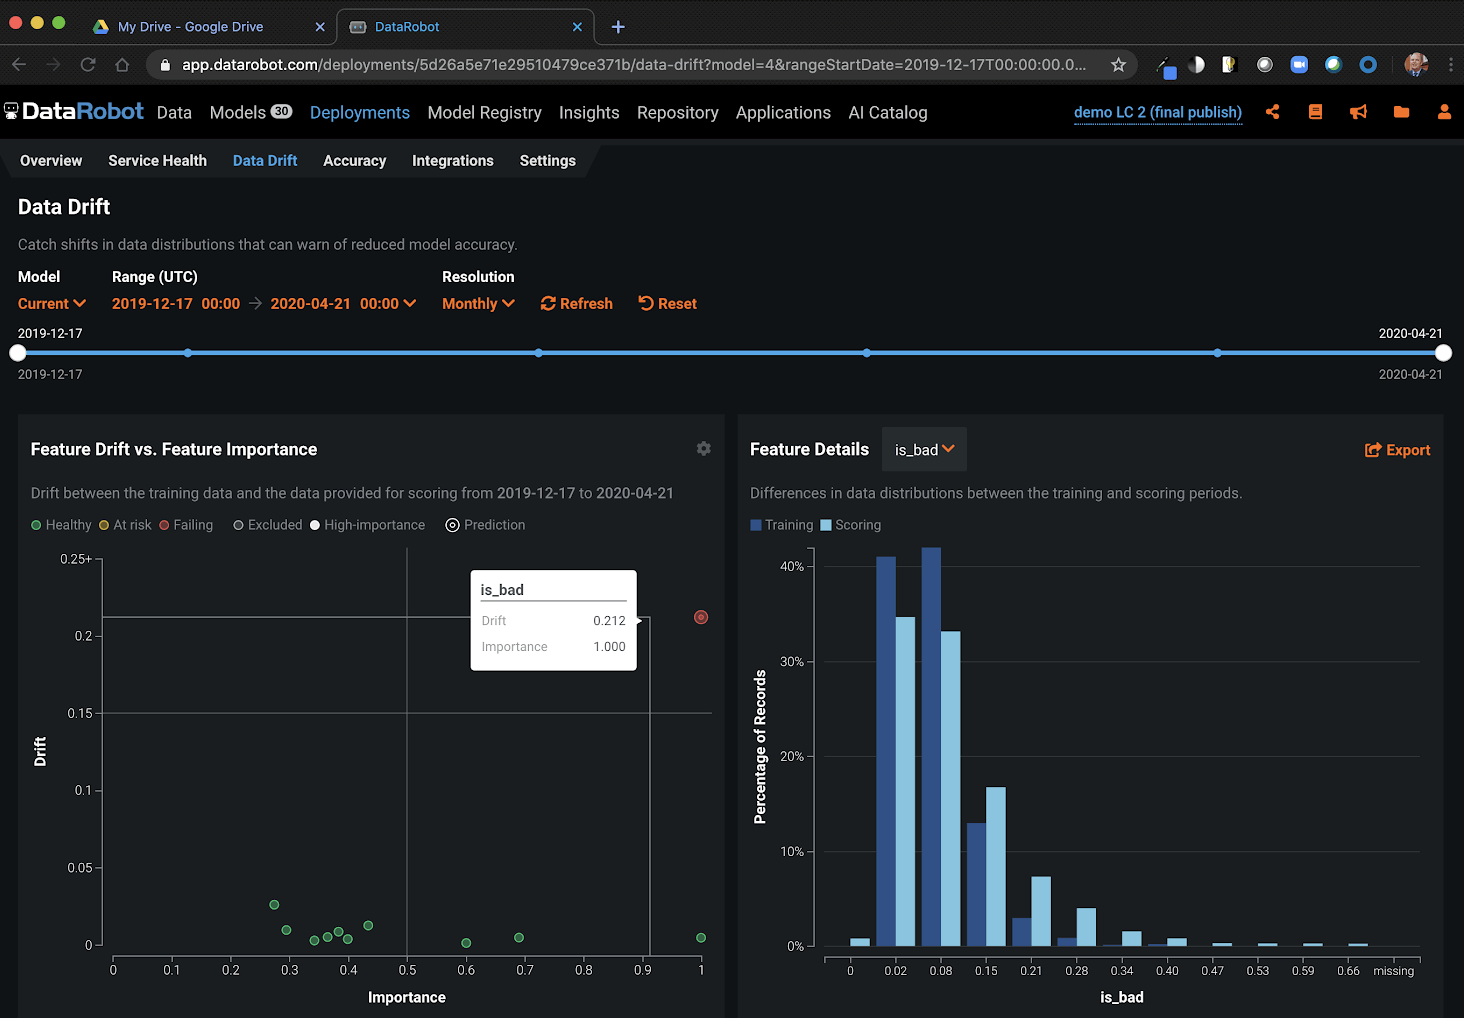 Above: DataRobot Data Drift
Check whether you can retrain. Do you have recent data? How are models built with it different?
It’s self-explanatory really: if you have recent data on prediction outcomes available to retrain your model, you should consider building a model which includes the updated data. Look at how the updated model compares with the performance of your deployed model on recently scored data — and remember that the accuracy of your deployed model at the time of training is not a good basis for comparison, unless you’re looking for a read on how much harder it has become to build models in the current environment.
Check your data. Is feature impact on the move?
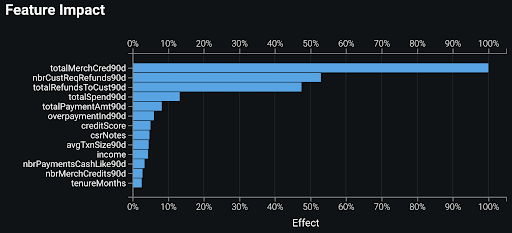
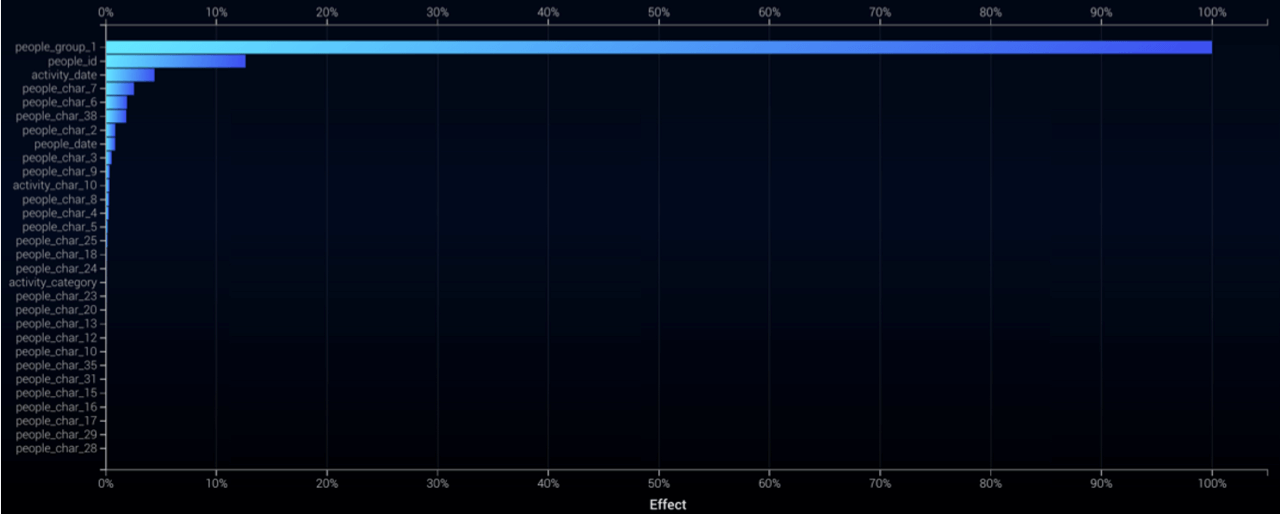
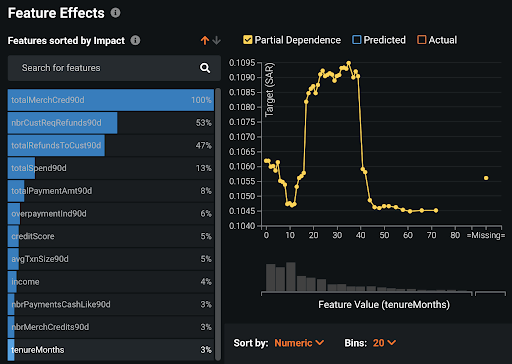
Also, consider building some models using only the recent training data, ideally covering only the Coronavirus period. Compare Feature Impact and partial dependence (in Feature Effects) for the new models with these analyses for your deployed models. Has the impact of various features changed? How has it changed? How have the sensitivities of predictions with respect to these features changed?
| Production Model | COVID-era Model |
 |
 |
 |
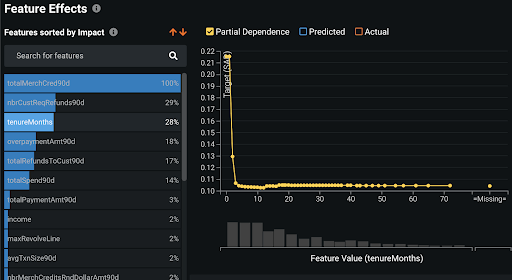 |
In the example above — scoring credit card accounts for anti-money laundering — the tenureMonths feature has become much more important since the start of the COVID crisis; the Feature Effects plots (lower row in the table above) show how the patterns relating to this feature have changed.
Check your business sponsor. What are they seeing? What do they need?
Equally important — don’t forget to stay in close contact with your business sponsors and internal clients. Even in more tranquil times, they are the best source of information you have on what data is important for your models: always ask what a subject matter expert would be looking at to make the decision you’re automating.
Check your problem statement. Should you reframe?
If your model performance has deteriorated substantially, be it from a change in behavior or a change in the values being served up for scoring, think about reframing the machine learning problem statement into something “easier” to model. This is where a good understanding of how model predictions are used is vital. Reframing a problem as a binary classification can be a very useful way to improve model performance: for instance, rather than predicting “how profitable will a customer be?” (a regression question), build a model to understand whether a customer’s profitability will exceed 20%. Instead of predicting “which toilet paper grade should I offer to a given customer?”, try modeling whether a given customer will buy your teddy-bear-buttocks soft, quilted toilet rolls product line.
Check your feature engineering. What more can you do with your data?
Also, consider what more you can do with the data you already have. If it’s likely that behaviors are changing over time, consider adding temporal features to your modelling: quantify that behavioral change. Or maybe historical levels are actually comparatively meaningless now, in which case you might consider how a particular reading looks compared to the average, minimum or maximum of the data that you have seen recently. Use DataRobot’s automated feature discovery and automated time series to streamline this process.
Check history. Can you find historical anchor points that you can use to adjust the models?
If there’s no up-to-date outcome data for you to retrain your models with, or the entire system’s behavior has changed, consider what parallels you can use from historical economic data. There is a great variety of openly accessible economic data on the internet, from sites such as FRED (for the US and internationally), Eurostat (for the EU), and e-Stat (for Japan) as well as from multinational organizations. These can help identify, for instance, which industries may be particularly vulnerable to an economic downturn, or particularly prone to cutting jobs. For example, the below graphic on employment volatility in EU countries by industrial sector was built entirely using Eurostat data; it provides a detailed (by country) ranking of employment risk in various high-level employment categories.
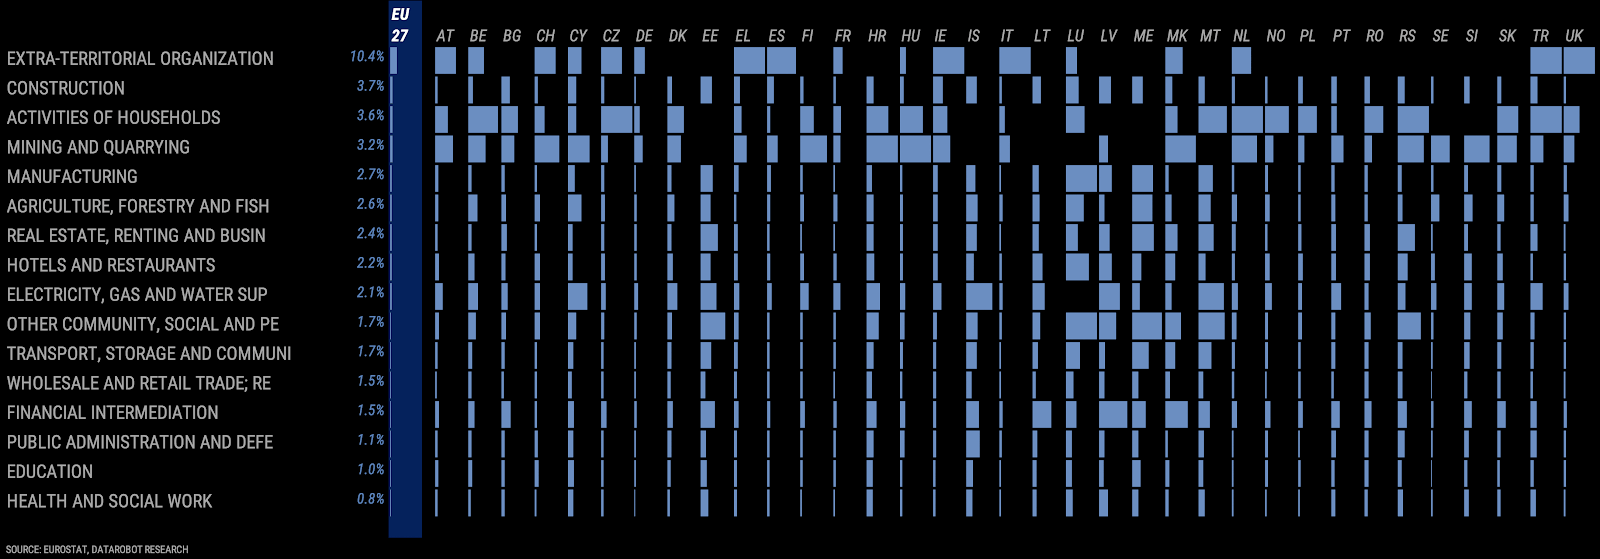 Above: Employment volatility in EU
Check your predictions. Do they (or the input data) need heuristic adjustments?
Using this kind of historical anchoring, you can adjust your model prediction outputs; for instance, depending on the industrial sector, you might want to tighten credit terms for deliveries, or add a temporary penalty to a credit score. Equally, you might want to adjust your model input data using rules based on this type of historical analysis; for instance, applying a variable income “haircut” depending on the industrial sector.
Check robustness. Build extreme scenarios from history and stress test your models.
Historical economic data can also be used to build scenarios — use history to inform your scenarios, adjust some scoring data to reflect these historical assumptions, score the data with your model and check how the model output compares to your production model output. Don’t forget that certain families of algorithms (in general, the tree-based ones) are less robust to making predictions on data beyond the range of values originally trained on. If one of your deployed models fits this description, consider whether to replace it with a model from a more outlier-robust family — just remember that, even if the predictions may seem more “sensible”, they are still extrapolations which should be taken with a grain of salt.
Check for anomalies. Evaluate incoming data against older observations.
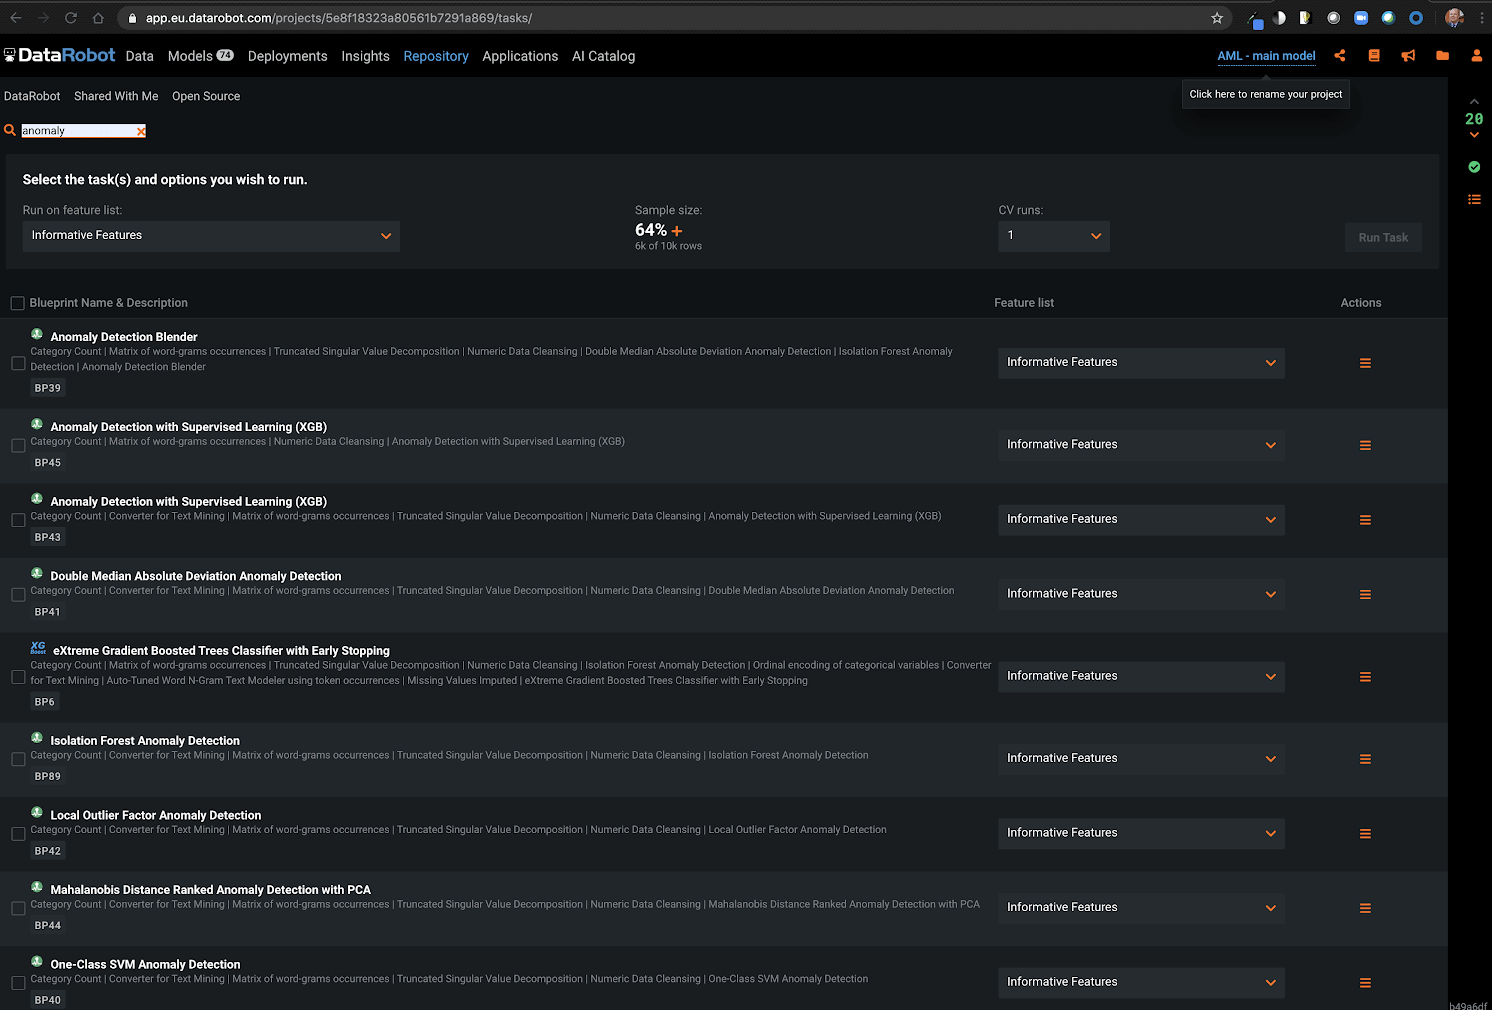
Finally, also consider adding an anomaly detection model to your machine learning pipeline — this kind of unsupervised model scores incoming data against training data and assigns an anomaly score. This gives you another line of defense against shifts in your scoring data and can also be used as a valuable input variable in your supervised machine learning models. DataRobot has a variety of anomaly detection algorithms available. Contact your friendly local DataRobot data scientist for more info.
 Above: DataRobot Repository
Check that you’re staying safe and frequently washing your hands with soap for at least 20 seconds.
Nothing to do with machine learning, but please stay safe and healthy. Please let us know if there’s any more information you need or anything further we can do to help. From us to you, we wish all the best and our hopes that these crazy times will settle down soon.
Check out this webinar if you’d like to learn more about the practical steps you can take to ensure that your predictions remain relevant and value-generative, even in situations where your training data does not yet reflect this new world.

Peter leads DataRobot’s financial markets data science practice and works closely with fintech, banking, and asset management clients on numerous high-ROI use cases for the DataRobot AI Platform. Prior to joining DataRobot, he gained twenty-five years’ experience in senior quantitative research, portfolio management, trading, risk management and data science roles at investment banks and asset managers including Morgan Stanley, Warburg Pincus, Goldman Sachs, Credit Suisse, Lansdowne Partners and Invesco, as well as spending several years as a partner at a start-up global equities hedge fund. Peter has an M.Sc. in Data Science from City, University of London, an MBA from Cranfield University School of Management, and a B.Sc. in Accounting and Financial Analysis from the University of Warwick. His paper, “Hunting High and Low: Visualising Shifting Correlations in Financial Markets”, was published in the July 2018 issue of Computer Graphics Forum.

Rajiv Shah is a data scientist at DataRobot, where he works with customers to make and implement predictions. Previously, Rajiv has been part of data science teams at Caterpillar and State Farm. He enjoys data science and spends time mentoring data scientists, speaking at events, and having fun with blog posts. He has a PhD from the University of Illinois at Urbana Champaign.
-
How to Choose the Right LLM for Your Use Case
April 18, 2024· 7 min read -
Belong @ DataRobot: Celebrating 2024 Women’s History Month with DataRobot AI Legends
March 28, 2024· 6 min read -
Choosing the Right Vector Embedding Model for Your Generative AI Use Case
March 7, 2024· 8 min read
Latest posts
