

The Lord of Light… GBM? Using an Algorithm to Predict Death in “Game of Thrones”
***Spoilers Ahead***
This blog is meant to be a fun and unique take on predicting which characters are likely to survive (or die) in the final season of “Game of Thrones”.
After finishing season seven of Game of Thrones, the record-breaking HBO show based on George R. R. Martin’s fantasy series A Song of Ice and Fire, we all have one question on our minds:
Who will actually sit on the Iron Throne in the end?
As the show enters its final season, many of us are eager to find out how the showrunners will end the story. Since the beginning, a myriad of different characters from several regions have been introduced, all with their sights set on ruling the kingdom of Westeros (i.e., securing the Iron Throne for themselves).
One of the most unique aspects of the series is its fearless approach to eliminating major characters (e.g., the Red Wedding, the Purple Wedding, Explosion of the Sept, etc.). This defining trait has led to some fascinating predictive analyses, such as creating Bayesian survival models and leveraging machine learning techniques to predict the likelihood of death for our beloved characters. In particular, the latter analysis scraped data from a fan-created Wiki in order to make predictions on approximately 2,000 characters using various descriptive characteristics such as their house of allegiance and gender.
I was interested in analyzing those ~2,000 characters with machine learning as well. Naturally, the task of actually predicting who will die in the series is extremely complex and requires more than just descriptive information. However, I was excited to apply the newly-developed tree-based approach, light gradient boosted machines (LightGBMs), in this context as a fun exercise to learn more about them. LightGBMs operate similarly to other popular tree-based methods, but instead of growing many deep trees, they grow many wide trees. The result is faster training time, smaller memory consumption, and better generalization on new data. With just the click of a button, these have recently become available within the powerful framework of DataRobot, an automated machine learning platform.
Exploratory Data Analysis
As with any machine learning project, it’s important to look at your data. I wanted to stick to a relatively straightforward set of features, so I investigated what house and culture a character belong to, their title, gender, nobility status, age, and if any of their relatives had died. Using DataRobot’s text modeler (word cloud), we can gain insight into which houses are more correlated with death.
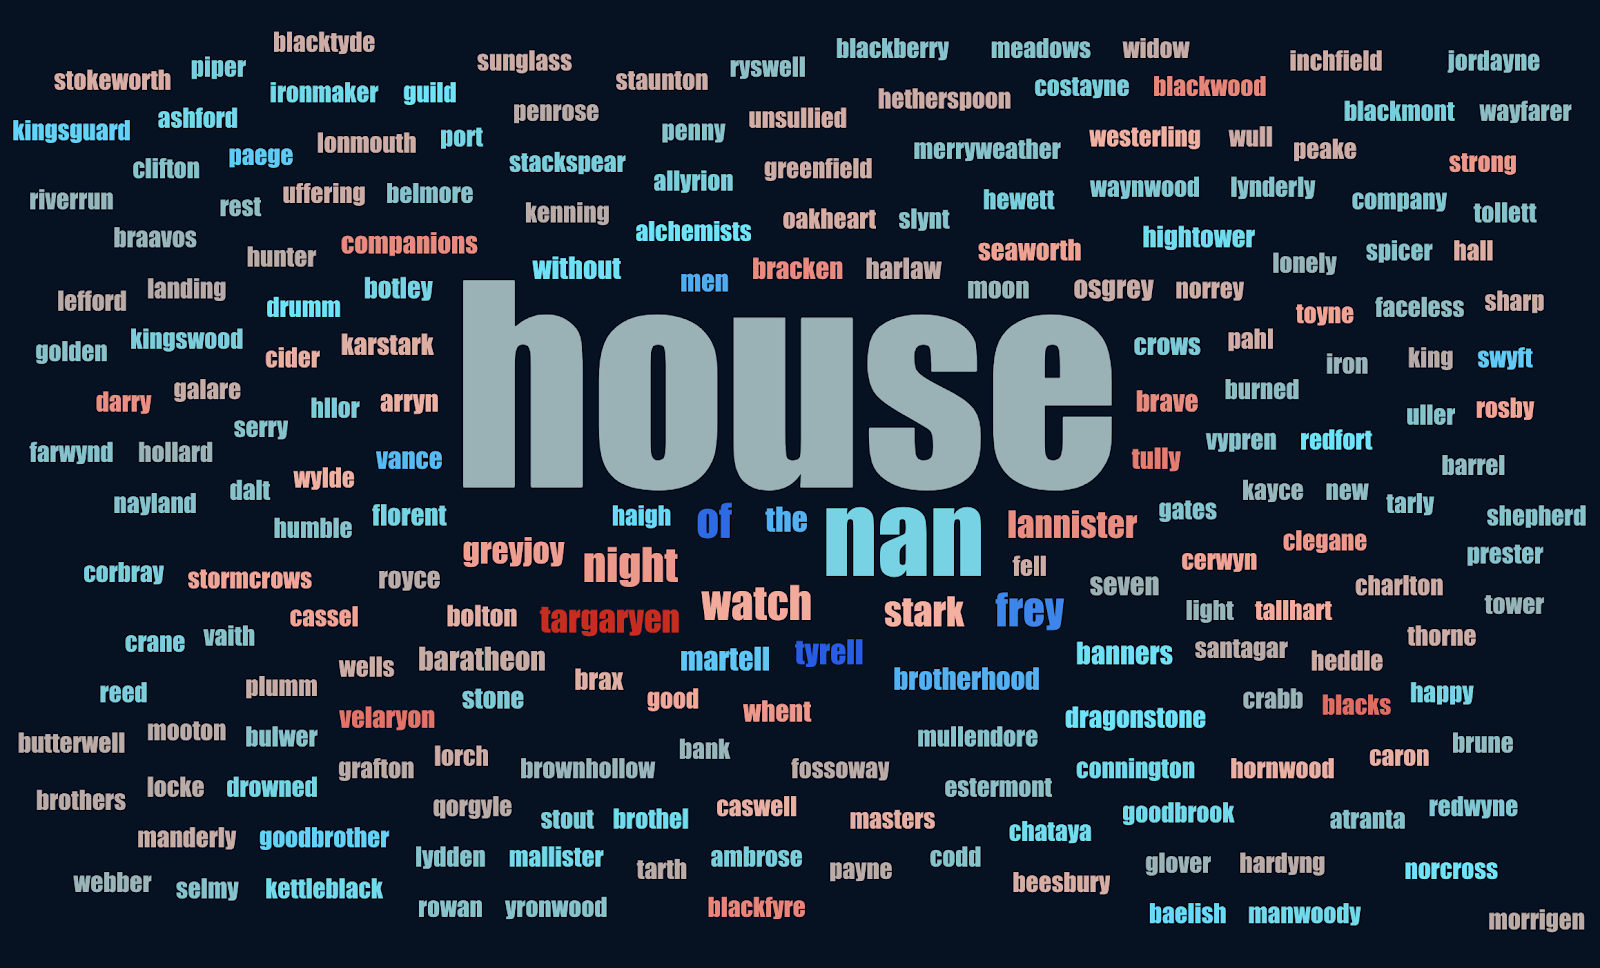
The larger the words are in size, the more frequently characters stem from that house. Houses written in text that are more red in color are more associated with death, while text that is more blue in color represents words that are safer. For example, it is no surprise that “night” and “watch” are colored red, denoting those characters who are in the Night’s Watch. They have the difficult job of defending mankind from the dangers that lie in the outskirts of Westeros.
The obvious stand-outs in terms of color are “Targaryen” and “Tyrell.” Targaryen is extremely red, with approximately 67% of those characters (allegiant to House Targaryen in the dataset) succumbing to death. This makes sense, given that the Targaryens previously sat on the Iron Throne before a rebellion led to much of the family’s demise. As for the Tyrell family, their name is extremely blue with only around 5% of those characters marked as deceased in this dataset.
In addition, with Martin being an avid fan of creating shocking plot twists involving the intricacies of the political climate in Westeros, perhaps predicting the likelihood of death would be better suited for applications of game theory rather than via machine learning.
For those of you who are avid fans of the show, you’ll note that many key players in this family were killed in seasons six and seven so this may seem contradictory. However, the strong blue color can be attributed to the fact that the data collected is based on the books and not the show. Much of what has happened in the last two seasons of the show is what is expected to occur in The Winds of Winter, which has not been released yet. In addition, with Martin being an avid fan of creating shocking plot twists involving the intricacies of the political climate in Westeros, perhaps predicting the likelihood of death would be better suited for applications of game theory rather than via machine learning.
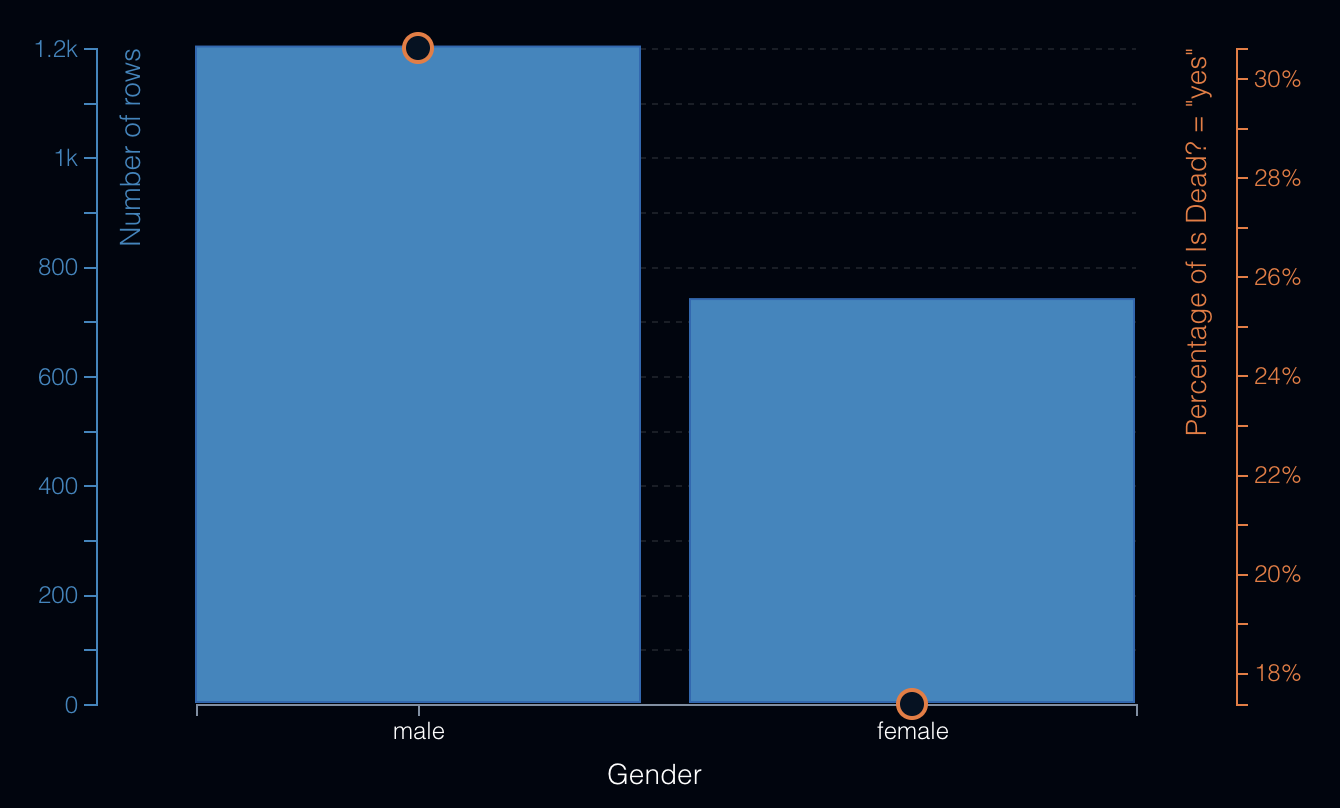
Taking a look at gender, we can see that not only are fewer female characters in the books, but they also die less frequently compared to males. This is undoubtedly indicative of males being involved in the various battles of the series.
Modeling
Now that we’ve done some initial exploration, let’s execute the model. For each machine learning algorithm in DataRobot, the platform builds a blueprint that optimizes the data for that specific algorithm. This is automatically done, circumventing the need to spend endless hours trying out different combinations of preprocessing steps. DataRobot is smart enough to create these for us, without manual intervention.
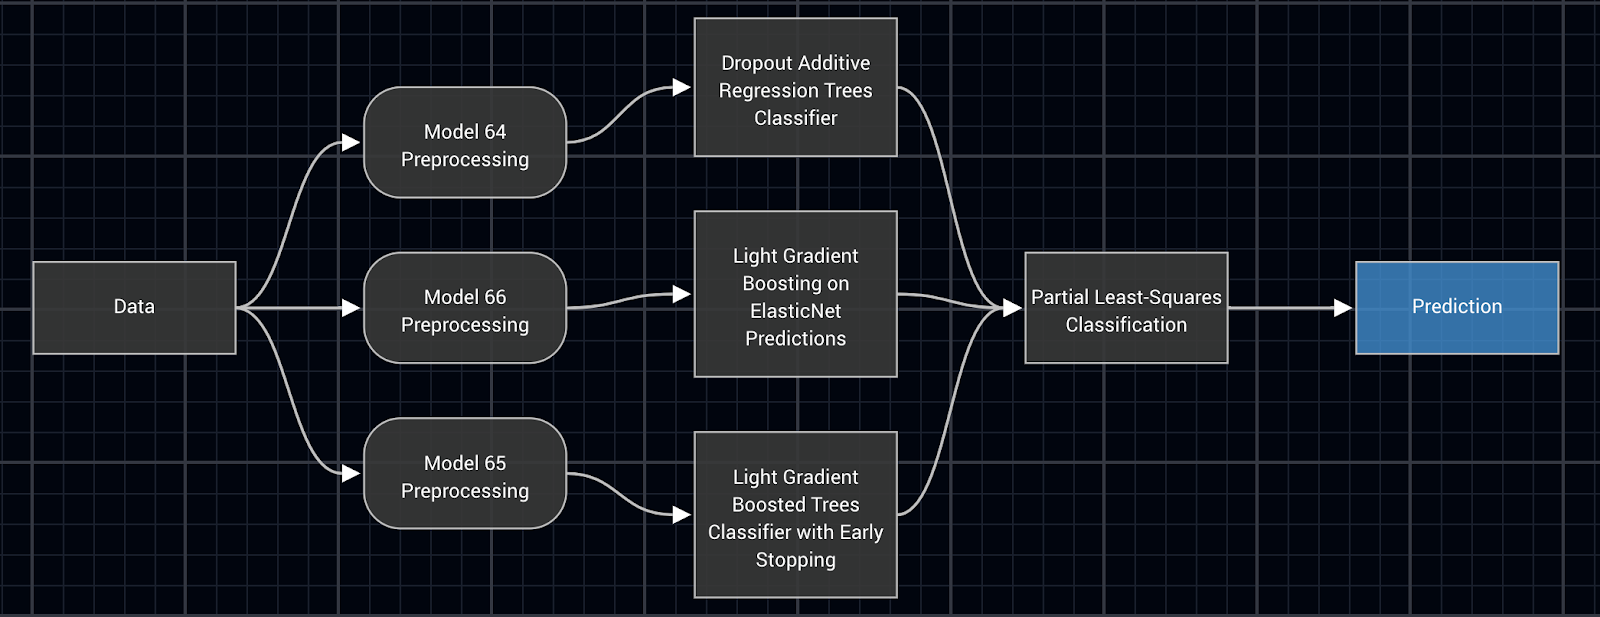
In addition to having an easy model building process, model blending is just as simple. Blending, or ensembling models together, often creates more powerful predictions. In this particular case, various LightGBM based blueprints are combined using partial least squares, generating greater accuracy than any of the three by themselves. The above blueprint is used for the following analysis.
Insights
As with any DataRobot model, we can investigate the important factors and their relationships with surviving in Game of Thrones.
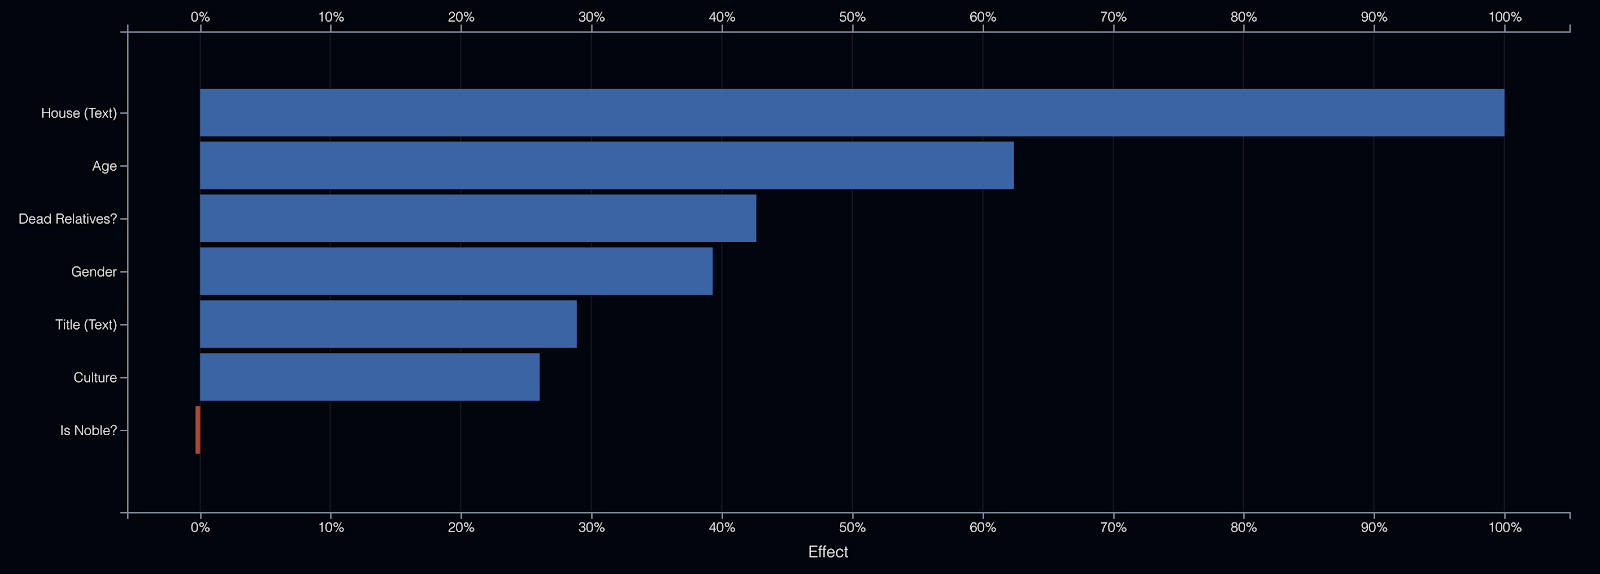
Using a technique called feature impact, we can see that characters’ house of allegiance, age, whether they had dead relatives or not, and their gender are the most influential pieces of information. The emphasis on house makes sense, since this indicates the types of situations and plot points these characters find themselves in as part of the story.
To examine the exact relationship between death and the features, we can use a method known as partial dependence. Take for instance a character’s age:
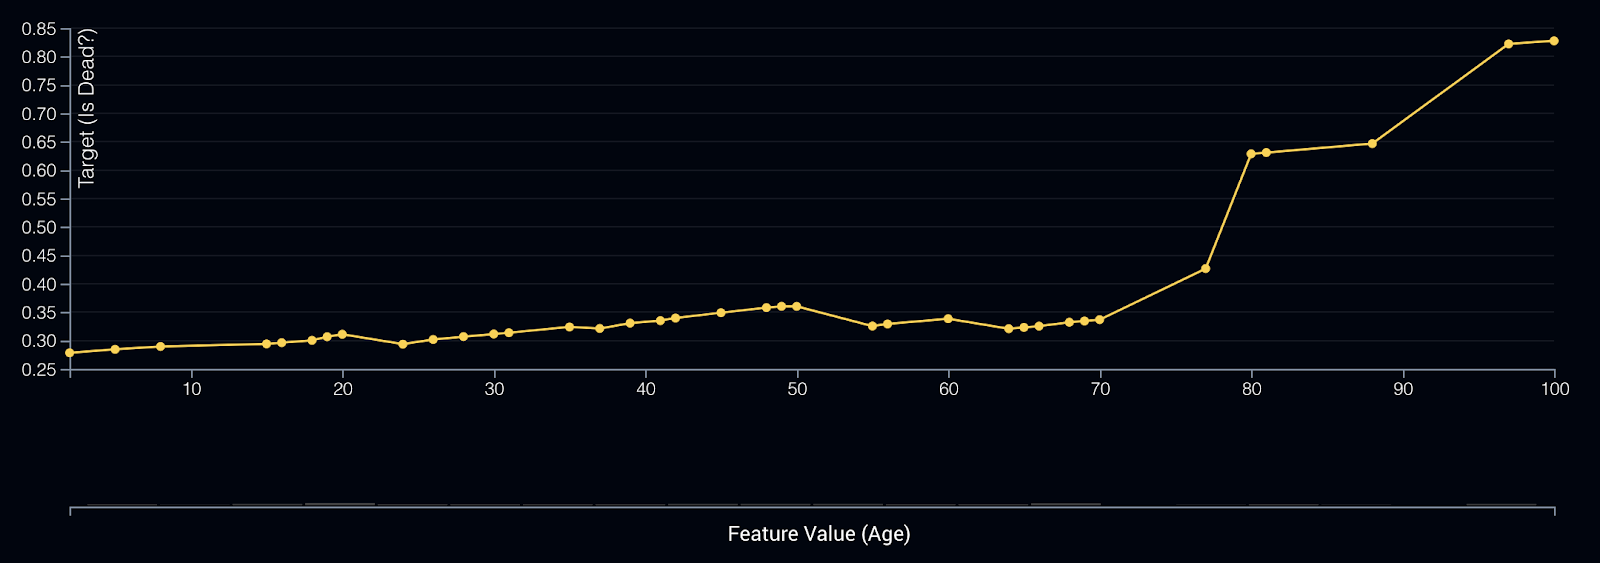
The yellow line indicates how the predictions change as we increase the value of age, keeping all else the same. This relationship is highly nonlinear, with those in their 80s being twice as likely to die compared to those characters in their 30s, which biologically is intuitive. This also highlights one of the advantages of using flexible, tree-based approaches: the ability to more easily capture nonlinear effects in the data compared to standard linear-based approaches, like regression.
Finally, we can take a look at the predicted death probabilities for some of the characters who could potentially sit on the Iron Throne in the end. Not only this, but with the help of prediction explanations in DataRobot, we can see the top three reasons for why that prediction was made. Red coloring indicates those factors that increase their probability for death, while the blue signifies those that decrease it.
|
Name |
Chance of Death |
Reason 1 |
Reason 2 |
Reason 3 |
|
Daenerys Targaryen |
83.77% |
Dead Relatives? = ‘yes’ |
Culture = ‘valyrian’ |
House (Text) = ‘House Targaryen’ |
|
Jaime Lannister |
72.91% |
Dead Relatives? = ‘yes’ |
Gender = ‘male’ |
Age = ‘39.0’ |
|
Tyrion Lannister |
70.76% |
Dead Relatives? = ‘yes’ |
Gender = ‘male’ |
Age = ‘32.0’ |
|
Bran Stark |
66.02% |
Dead Relatives? = ‘yes’ |
Culture = ‘northmen’ |
Gender = ‘male’ |
|
Cersei Lannister |
60.39% |
Dead Relatives? = ‘yes’ |
Gender = ‘female’ |
Age = ‘39.0’ |
|
Jon Snow |
58.99% |
Dead Relatives? = ‘yes’ |
Gender = ‘male’ |
Culture = ‘northmen’ |
|
Euron Greyjoy |
54.95% |
Dead Relatives? = ‘yes’ |
Culture = ‘ironborn’ |
Gender = ‘male’ |
|
Sansa Stark |
50.28% |
Dead Relatives? = ‘yes’ |
Gender = ‘female’ |
Culture = ‘northmen’ |
|
Arya Stark |
49.04% |
Dead Relatives? = ‘yes’ |
Gender = ‘female’ |
Culture = ‘northmen’ |
|
Gendry |
39.87% |
House (Text) = ‘brotherhood without banners’ |
Dead Relatives? = ‘yes’ |
Gender = ‘male’ |
Some interesting points:
- The majority of characters’ most important reason was whether or not they had dead relatives. Naturally, this serves as a proxy indicating the amount of turmoil in each family’s history.
- Being a part of the “northmen” culture seems relatively less risky, while being “valyrian” has the opposite effect.
- The Lannister siblings, Jaime, Tyrion, and Cersei, all have higher probabilities to die in part due to their older ages.
- Males are inherently more at risk, as seen in the exploratory data analysis phase.
- Of the ten people listed, the Mother of Dragons, Daenerys, has the highest chance to die while Gendry, the illegitimate son of the former King Robert, has the lowest.
While it’s a fun exercise to use book details to predict future plot points in the show, it’s ultimately going to be the showrunners who decide the fate of Westeros and all those who are involved.
Thanks to DataRobot, we were able to use the newly-developed LightGBM algorithm to analyze relationships and make predictions as to the survival chances for various Game of Thrones characters. According to the results, the amiable character Gendry seems to have the best shot at surviving in the end, potentially enabling him to rule the kingdom.
While it’s a fun exercise to use book details to predict future plot points in the show, it’s ultimately going to be the showrunners who decide the fate of Westeros and all those who are involved. After all, I’m not even sure a machine learning algorithm could have predicted the amount of emotional distress this show has caused, and will continue to cause, as we all wait for the Long Night to come to an end.
A key aspect of data preparation for machine learning is that the historical data will be similar to the predicted future data (i.e risk characteristics in historical data sets associated with loan defaults will also appear in the future). However, Game of Thrones is not set up in this way as the element of surprise is one of the reasons why the show has been so successful. Therefore, we can expect the season finale to have twists and turns intentionally added in by the writers that will not be picked up in the historical data gathered from the previous seasons. This blog takes a unique approach, but DataRobot’s automated machine learning platform truly shines when solving real-world problems across all industries. Visit our Solutions page to learn all about the use cases we’ve implemented across various industries to successfully solve real-world problems.

About the author:
Taylor Larkin is a Data Science Evangelist at DataRobot. Based out of Atlanta, he’s responsible for teaching data science best practices by leading training sessions, developing course content for DataRobot University, and helping academic institutions integrate DataRobot into the classroom. He has worked on machine learning projects and research articles in a variety of realms including geomagnetic storm prediction, healthcare, renewable energy, sports analytics, and wine preference. Prior to joining DataRobot, Taylor graduated from The University of Alabama with a PhD in Business Analytics and an MS in Applied Statistics.

Taylor Larkin is a senior data scientist at DataRobot. Based out of Atlanta, he’s currently responsible for leading and executing data science projects with customers. He has worked on use cases in a variety of realms including financial markets, marketing, transportation, and healthcare. Prior to joining DataRobot in 2017, Taylor graduated from The University of Alabama with his PhD where he proposed ways to improve geomagnetic storm prediction using machine learning. He enjoys spending his free time with his wife and old dog, Pearl.
-
How to Choose the Right LLM for Your Use Case
April 18, 2024· 7 min read -
Belong @ DataRobot: Celebrating 2024 Women’s History Month with DataRobot AI Legends
March 28, 2024· 6 min read -
Choosing the Right Vector Embedding Model for Your Generative AI Use Case
March 7, 2024· 8 min read
Latest posts
