

When you Have the Right Data in the Wrong Format
“Most of the evil in this world is done by people with good intentions.” -TS Elliott
I recently spent several days fixing a dataset that someone had clearly spent many hours putting together.
The data source was from a Stanford study called “How Couples Meet and Stay Together” and can be found here. This publicly available data catalogs the experience of 4,000+ couples over the course of several years. It documents the origins of each relationship, describes how the features of those relationships change over time — household size, sexual orientation, income, and so on — and records whether or not each relationship lasted.
The researchers do this by means of surveys — lots of surveys. By my reading there were as few as 5 surveys, and potentially as many as 10 surveys over the course of several years. There were two distinct surveys: one collecting background demographic information and one collecting relationship status information. Each survey has been administered multiple times.
Now, there are a huge number of questions that can be explored using the information that has been collected in these surveys, and lots of media outlets have written stories based on this data. Judging by the study homepage, the most interesting thing about this data is what it can tell us about how likely a person is to use an online dating service.
In my view, though, what kinds of couples meet online is probably the least interesting thing in this dataset. So why so much interest? I think it’s because of the way the data is structured. Which couples met via the Internet is dead easy to determine from the dataset.
How did the researchers lay out the dataset? One row per couple:
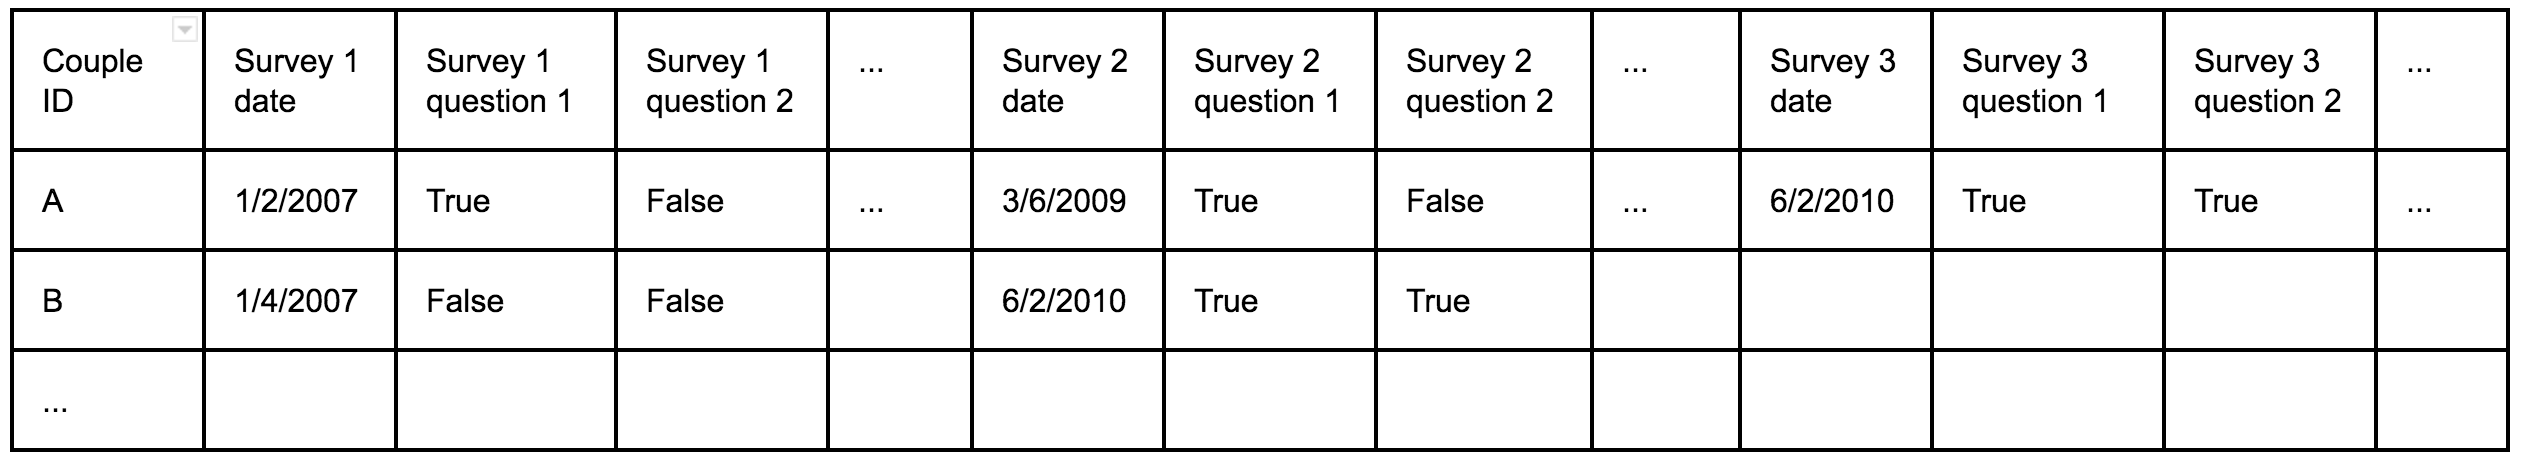
This structure means that it is very easy to understand the characteristics of any couple: Where did they meet? Are they of the same gender? What race are they?
But how do you answer questions like: Did the couple stay together? How many children does each couple have?
These questions are much harder to answer — not because they’re complex or difficult to understand — but because the data isn’t laid out to answer them. For instance, it would be easy to determine how many children a couple had when they took survey 1, but every couple took that survey at a different time, so it isn’t obvious what those results would even indicate.
To make matters even more difficult the same question in repeated surveys had different feature names, meaning that I had to slog through their 336 page codebook to determine which question in survey 1 corresponds to the same question in survey 2.
The crazy part of all of this is that the data wasn’t collected this way. Some poor graduate student went out of their way to do this to the data.
Reflecting back on the experience, I realize that it wouldn’t have been any more work for the person who originally built the dataset to have put it together differently, but it would have required adhering to a few simple principles.
Data should be organized to solve specific problems
Different stakeholders have different priorities for data. Tech teams that work in operations departments, for instance, are interested in making sure that the call center operators can get (near) immediate access to the current state of any customer in your data store. Operations teams don’t really care what a customer’s data looked like last week or last year. The history isn’t relevant; only the current, most up-to-date status of every customer matters. Oh, and the data has to be 100% available, 100% of the time, or it’s a big, BIG problem.
Reporting teams, on the other hand, don’t really care about access times or latency. They’re interested in making sure that the number in last month’s report exactly matches the same number in this month’s report — down to the penny. These are the people that have your company’s earnings memorized for the last 5 years. They check and double-check every report to make sure that everything adds up.
Compliance teams have still different priorities.They’re interested in keeping the right data for the right amount of time. It’s a totally different point of view.
The traditional approach is to build a single source of data (how many times have we all heard the phrase “single source of truth”?). This is a terrible idea. Different stakeholders have different priorities, and trying to build a single data source that meets everyone’s needs guarantees that nobody will be efficient or happy.
Four Characteristics of Useful Analytics Data
Snapshot-ability
I need to be able to determine what my data looked like at any point in time. In other words, I may not care what kind of car you’re driving today. I need to be able to tell what kind of car you were driving on March 3, 2008 and on October 17, 2014, and so on. I also need to know when I learned this information.
Accessibility
If I can’t access my data, then I can’t use it. The four most common blockers to data access are:
- The data is in an access database sitting on someone’s desktop. This can’t happen. Stop the madness.
- The data is “too sensitive.” Data security and sensitive data is top of mind these days, and often the lawyers just say, “no!” The good news is that PII data is frequently not needed for many projects. The better news is that most of the time, there’s a simple way to get good results without creating risk for the company — if there’s sufficient motivation to look for a compromise.
- The tools are too unfamiliar. Sure, Hadoop is cheaper than Teradata. Too bad SQL coders outnumber Hadoop experts 1000:1. If you’re going to invest in new tools, you also have to invest in large-scale training or you will dramatically shrink the number of people that can produce good results from your data.
- We haven’t built it yet. A data management team focused on building the perfect data warehouse (over the course of the next five years, of course) is a time-suck that will kill your analytics — and they’ll never actually finish.
History
It should go without saying that you should keep your data. I worked with a Fortune 50 company that takes any data older than three years and puts it on tape back-up; that is, if it happened more than three years ago, you can’t get it. Data is a massively valuable corporate asset. Please, don’t put it in the deep freeze.
Consistency (a.k.a., don’t ruin your data)
A company that I worked at was changing vendors for one of the front-end systems that was used in their call center. Rather than create new columns and tables for the new data that was being captured, they decided to store (slightly) different data in the same columns as the old data — even though it was collected at a different point in time by different people and had different meanings. That meant that from that day forward, everyone that looked at those columns of data had to know what day that change happened and adjust their analysis accordingly.
That’s an extreme example, but much more subtle things can impact the consistency of your data over time. Organizational changes, personnel changes, software updates, changes to upstream data processes, and so many other things — some unavoidable — can impact the meaning of your data over time. Taking steps to prevent these changes, where possible, is a great idea. When they do happen, making them really, really obvious, will maximize the usefulness of your data.
By the way…
A colleague reading this (sorry, Tim) said something along the lines of, “Oh yeah! Isn’t 3rd-normal-form great?!” Sadly, not great. Analytics can’t be done on a normalized database out-of-the-box. Having your highest paid analysts (data scientists) working on denormalizing your database is not the best use of resources. The moral of this story is: Structure your data in a way that maximizes the efficiency of the people who use it. That may mean storing multiple copies in different formats in different places, but the cost of doing this will surely be less than the cost of fixing your data every time your organization starts a new project.
by Greg Michaelson, Director of DataRobot Labs
-
How to Choose the Right LLM for Your Use Case
April 18, 2024· 7 min read -
Belong @ DataRobot: Celebrating 2024 Women’s History Month with DataRobot AI Legends
March 28, 2024· 6 min read -
Choosing the Right Vector Embedding Model for Your Generative AI Use Case
March 7, 2024· 8 min read
Latest posts
